This Matrix Is Real: Using Win Expectancy Matrix Calculations During Live Baseball Games
You might have caught World Series Fever if you’re a baseball fan. With much hanging in the balance during playoff season, I turn to stats to help make sense of potential victories or upsets. My favourite tool lately is the Win Expectancy Matrix. It’s a boatload of fun because you can follow along during live games - using calculations based on decades of data - to see the likelihood of a given team winning the very game you’re currently watching. I know. I’m grinning ear-to-ear with nail-biter energy, just like you.
Data and theory can be aggressively pointless without a viable case study. Especially when learning or teaching. For today’s case, I’ll use the October 17th, 2024 ALCS (American League Championship Series) game between the Cleveland Guardians and the New York Yankees. This is a great example to illustrate the nail-biter potential of a Win Expectancy Matrix because each team trades being ahead or down, back and forth, both holding a higher win potential at multiple points.
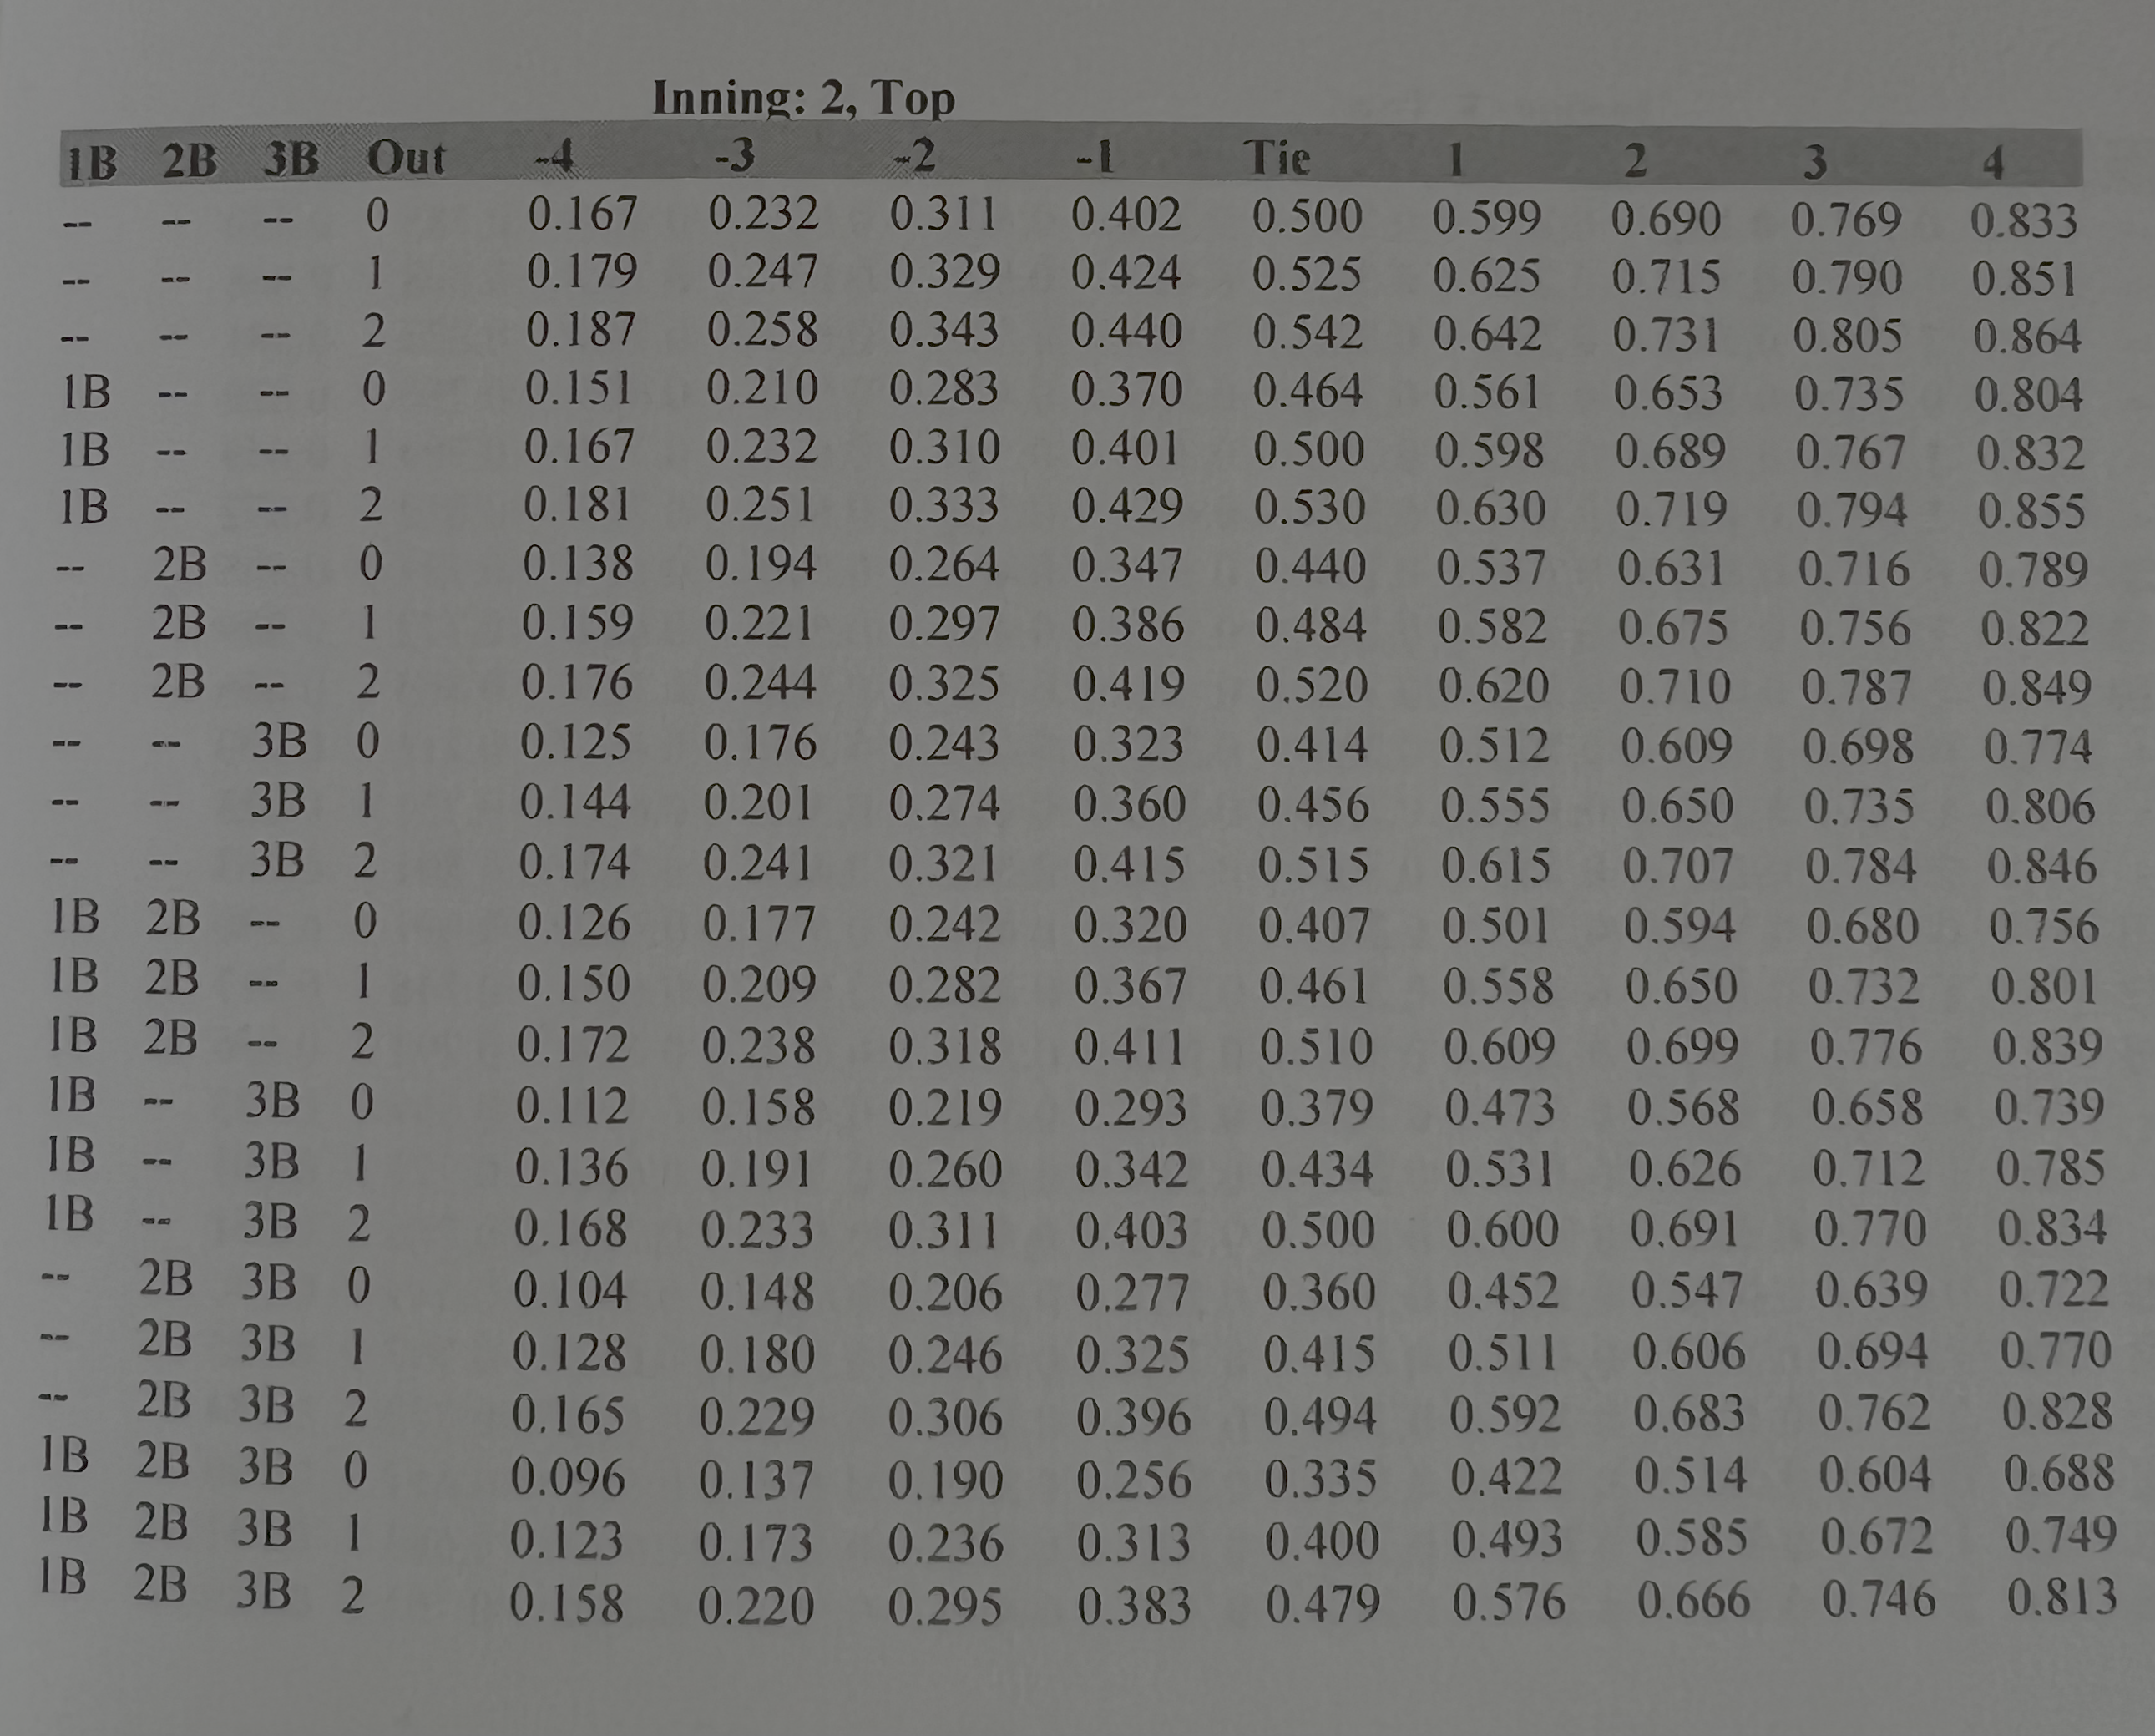
Figure 1. Win Expectancy Matrix, excerpt from “The Book: Playing The Percentages in Baseball” Tango et al. 2006
Now is the time for the theory and data explainers, on probability of winning a game, before we turn to the case study example. Figure 1 (above) shows calculations from the top of the second inning. From left to right, the headings illustrate Runners-on-base position (1B, 2B, 3B), number of Outs, and Score difference, spanning from -4 to +4.
Matrix Methodology
A couple of crucial notes. First, the matrix is always read from the perspective of the Home team. If the Home team is down 3, you’d look at the minus 3 column, while if the Home team is up 2, you’d look at the plus 2 column. And the resulting win percentage follows suit, too, reflecting the win chance for the Home team. So, for instance, if the Home team is up 2 runs in the Top of the second inning, where the Away team has 0 outs and runners on 1st and 2nd base, the Home team win expectancy is .594. This translates into a roughly 60% chance that the Home team will win at this very point in the game. If the Home team keeps this lead, with the Away team failing to score, by the time Home takes bats in the bottom of the 2nd, they now have a .742 or roughly 74% chance of winning today’s game. Cool huh?
Second, where crucial notes are concerned, what we’re not considering here are specific opponents, park effects, and teammates. Context. Data parameters and research limitations. Gotta love it. Why? Because parameters are containers that tell us what is necessary information, extraneous information, and why something specific might be the case. And not to confuse things, Figure 1 is from “The Book: Playing the Percentages in Baseball” (Tango et al. 2006) which is slightly different from the calculations used below, though these calculations are still derived from the very same Tim Tango anyhow. The difference? The former is calculated by Tango, Lichtman, and Dolphin, and assumes median data values from two teams that are “exactly average major league teams” from 1984-2000, while the latter are calculated solo by Tango himself, drawing on all MLB game data from 2010-2015. So, you’ll be glad to know that what follows draws upon more current statistics. All of these stats can be found on Retrosheet.
This is all a long way to say what my friend and fellow baseball data head, Will Mattfeld-Sarbaugh, far more succincly describes:
“They basically took the situational factors of relative score, inning, top/bottom, outs, and base runners - and then calculated which percentage of real games with those factors resulted in the wins.”
Et voilà. Allons-y!
A Lap Around The Bases
Personally, and conveniently in this case, the Guardians are the Home team and I don’t have to accidentally root for the Yankees simply by assuming they’re the Home-team. We’ll take each inning in turn, just as I did, while watching live. Let’s go!
1st Inning
No runs; tied 0-0
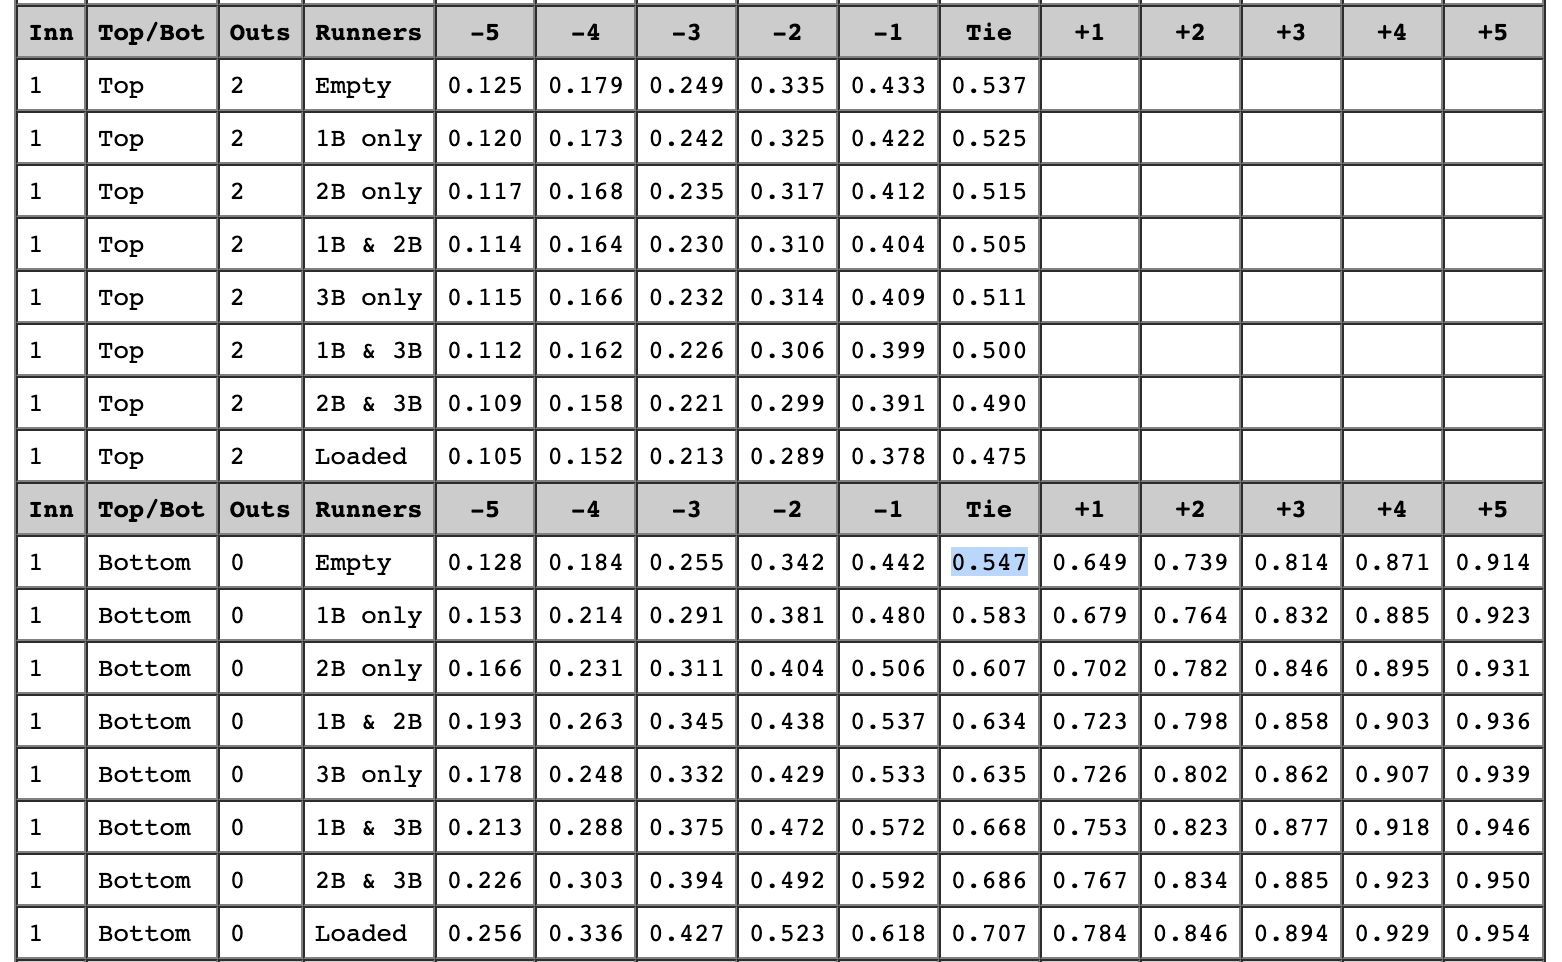
Figure 2. Top and Bottom, 1st Inning
Win Expectancy (WE) for Guardians @ end of Top of 1st, after Yankees didn’t score, stranding a player on 1st and 2nd base = .547 or ~55%.
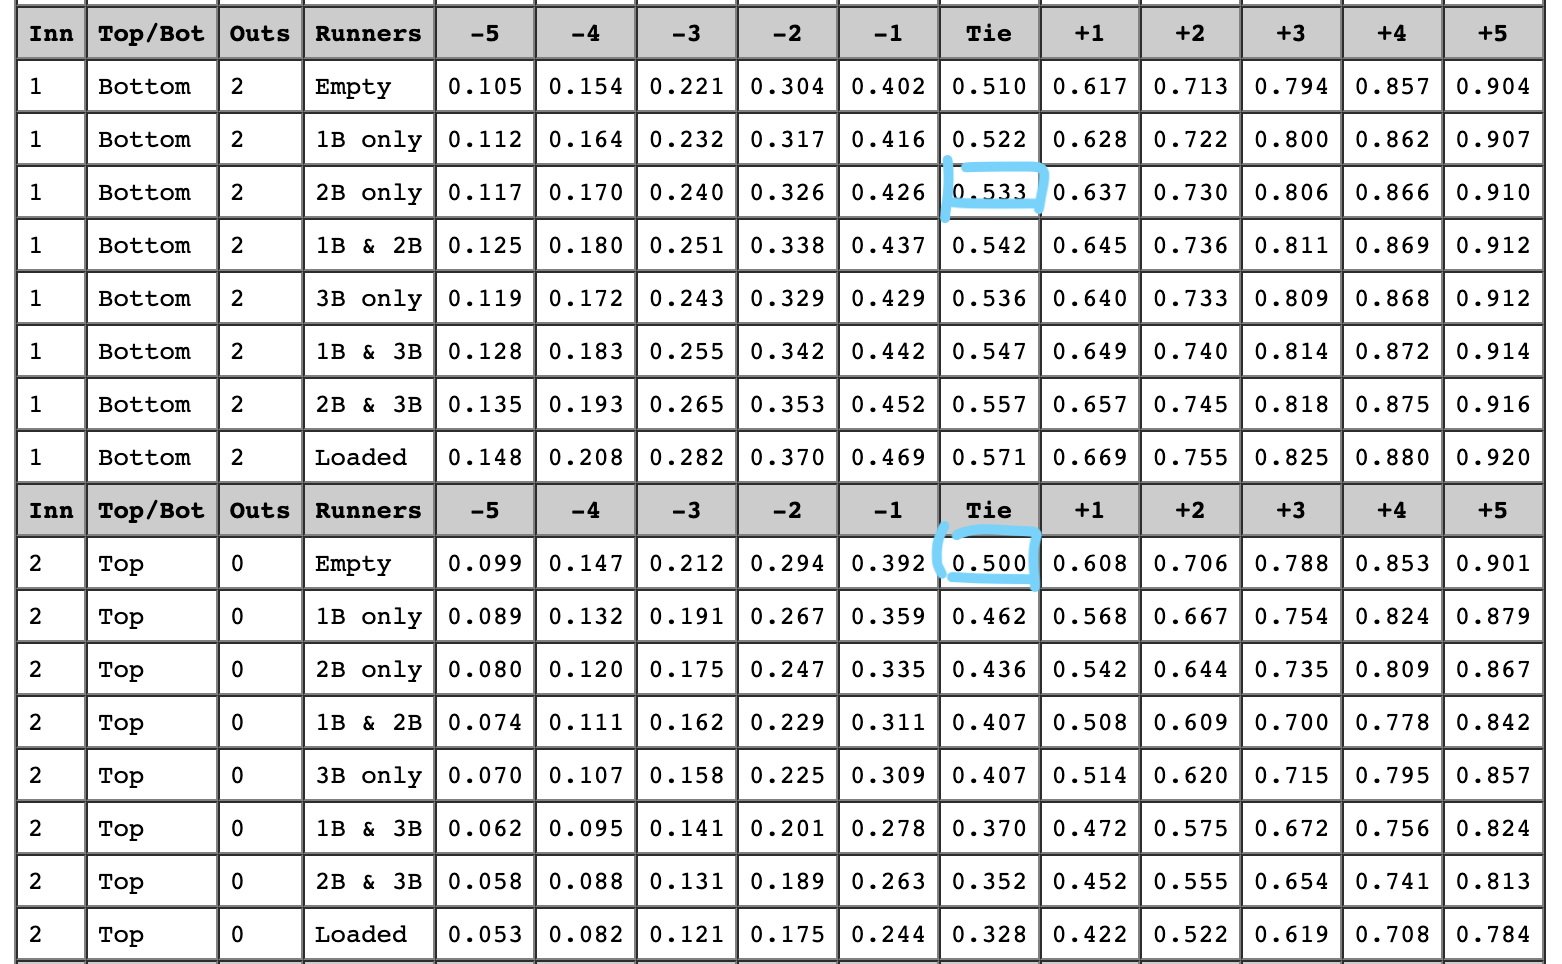
Figure 3. Bottom, 1st Inning; Top 2nd Inning
WE @ end of Bottom of 1st, when Guardians fail to score and strand a player on 2nd = .500 or 50%. But when the player was on 2nd, with only 2 outs instead of 3, the WE was .533, which means that a failures to score on both parts, by the end of the 1st inning, equalizes all back to 50/50 chance.
2nd Inning
Yankees score in the Top; End of inning the Guardians are down 0-1
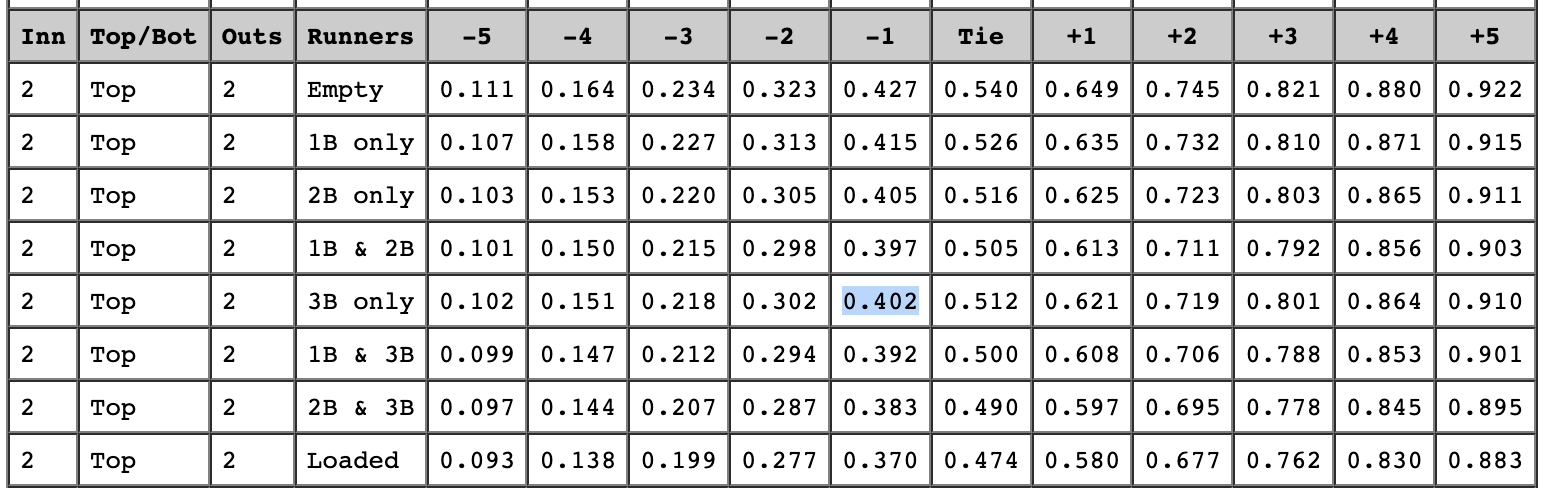
Figure 4. Top 2nd Inning
Win Expectancy (WE) for Guardians @ end of Top of 2nd, after Yankees score one run but stranding a player on 3rd = .402 or ~40%. But by the end of the Bottom of 2nd inning, after three consecutive outs, getting no one on base, The Guardians move to .383 or 38% chance. You can see this noted below in the “between inning” state represented by the Top of 3rd, 0 outs & no one on base for the Yankees (figure 4).
3rd Inning
Guardians score 2 in Bottom; End of inning the Guardians are up 2-1
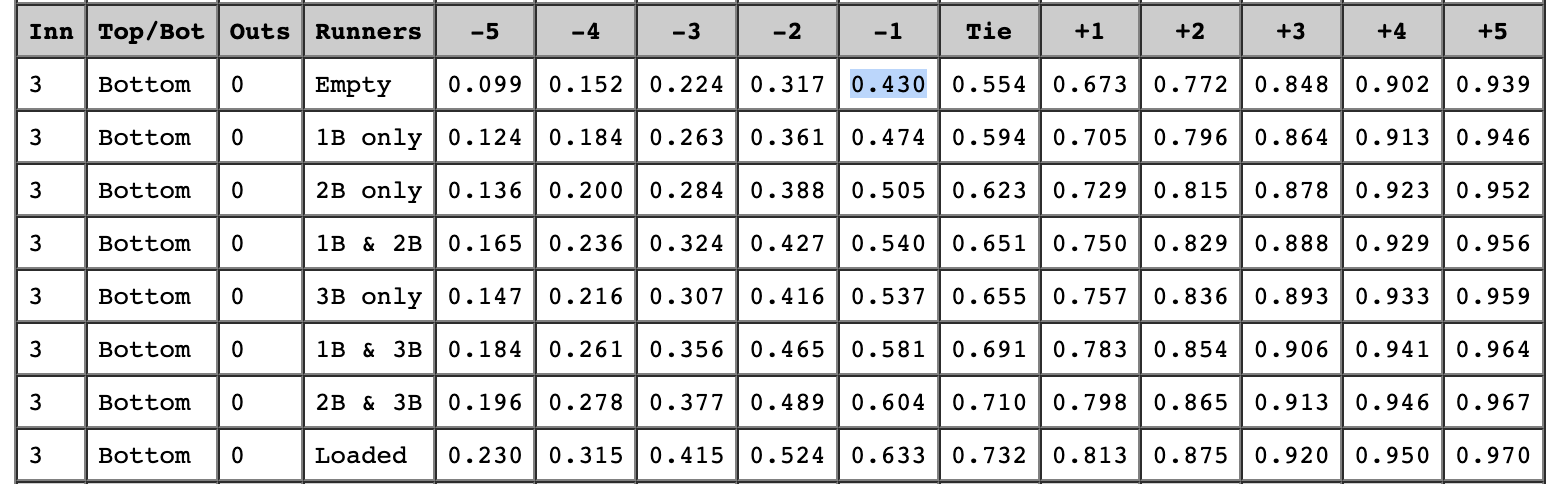
Figure 5. Bottom 3rd Inning
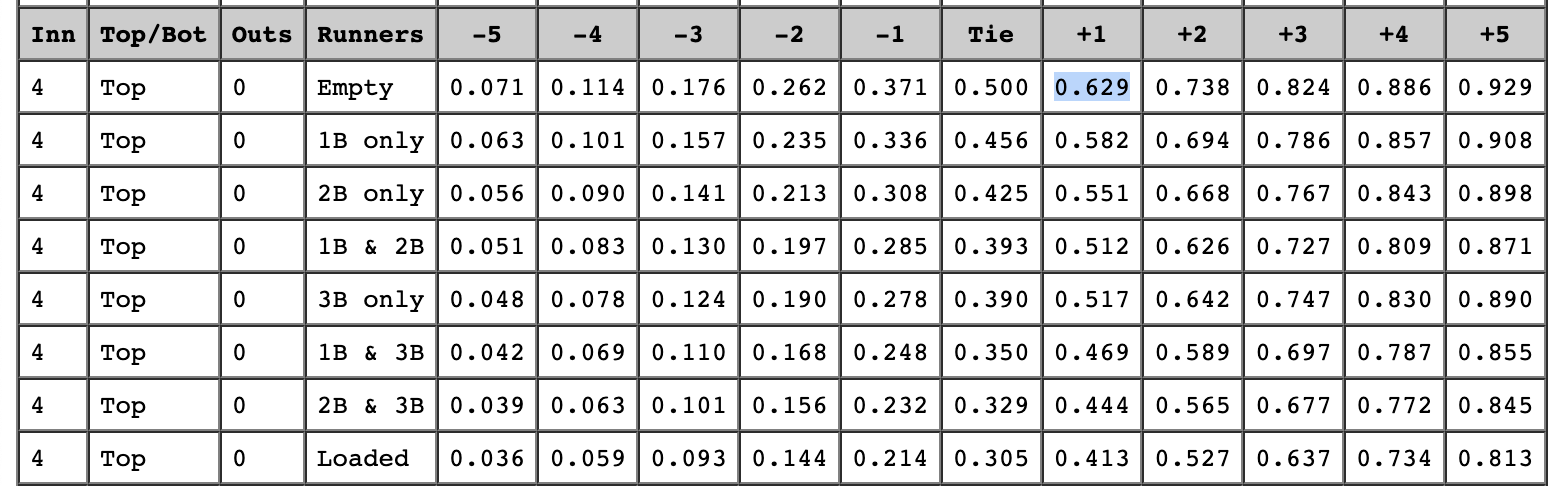
Figure 6. Top 4th Inning (representing between inning state)
Yankees fail to score, 3 batters up and down, in turn. So when the Guardians take bats at the bottom of 3rd, they have a .430 WE (figure 5). But! An exciting turn takes place with a runner on 1st, and a batter hits a home run, now taking the lead 2-1, turning that .430 WE to a .629 (figure 6).
4th & 5th Innings
No runs scored. Guardians still up 2-1
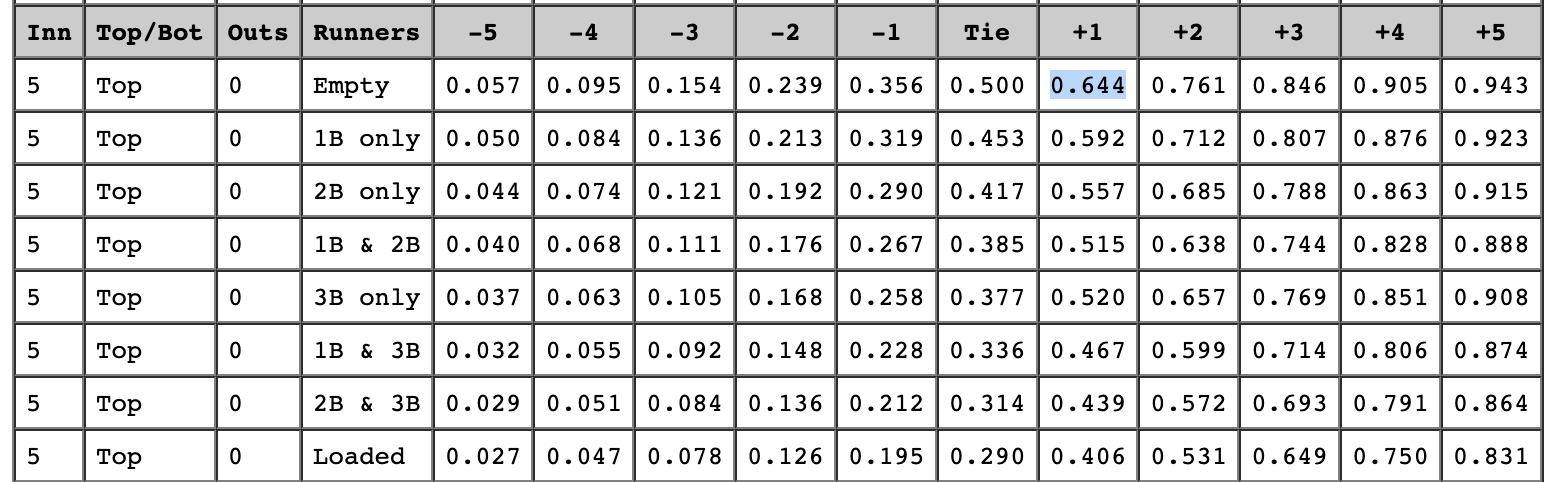
Figure 7. Top 5th Inning (representing between inning state)
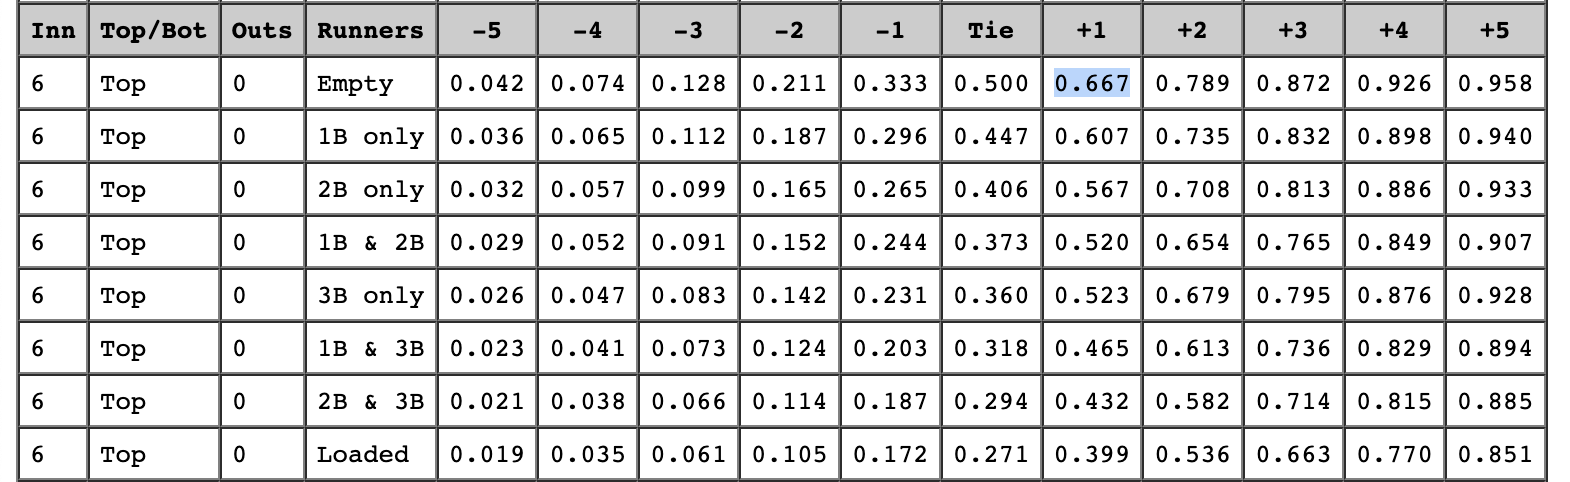
Figure 8. Top 6th Inning (representing between inning state)
With guardians getting on base twice in 4th & 5th innings, but failing to score, coupled with the Yankees getting only lineouts, groundouts, or flyouts, the Guardians WE by the end of each inning is .644 (figure 6) and .667, respectively. Now you’re beginning to see how even if the score is unchanging, the gap begins to close because there is less and less time to play, meaning that whatever the score is at a given point becomes more and more a potential final reality, thereby increasing or decreasing the WE proportionally.
6th Inning
Guardians score 1; Guardians up 3-1
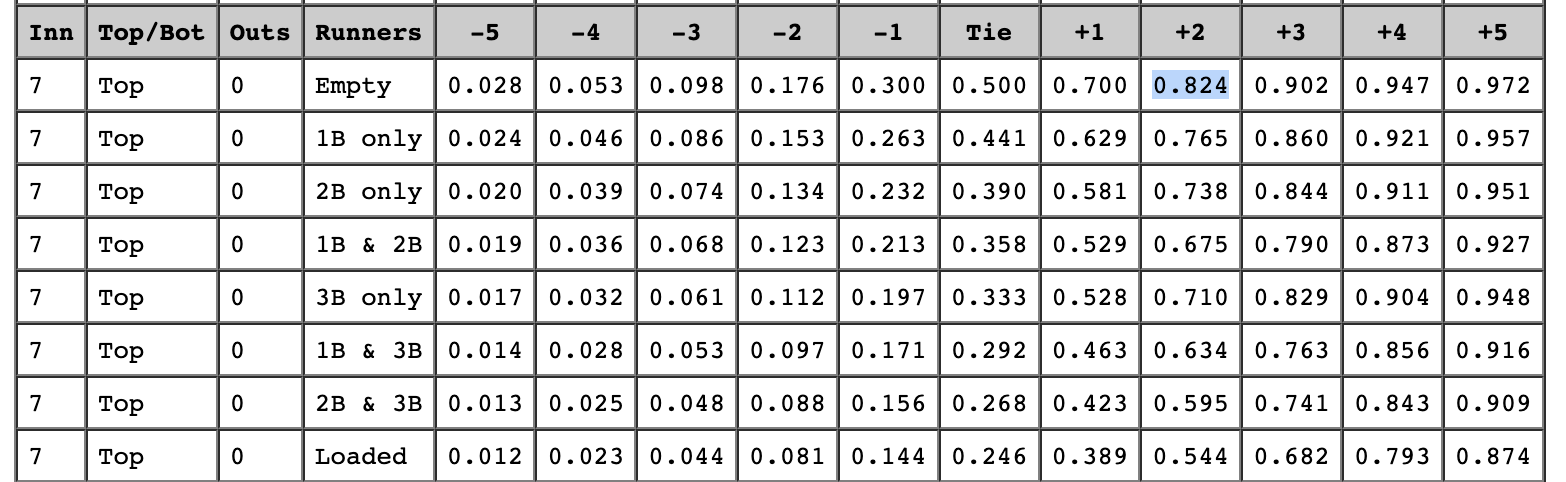
Figure 9. Top 7th Inning (representing between inning state)
The Yankees fail to score in the Top, and The Guardians score 1, taking their WE at the end of the inning to .824 or ~82% (figure 8).
7th Inning
No runs scored. Guardians still up 3-1
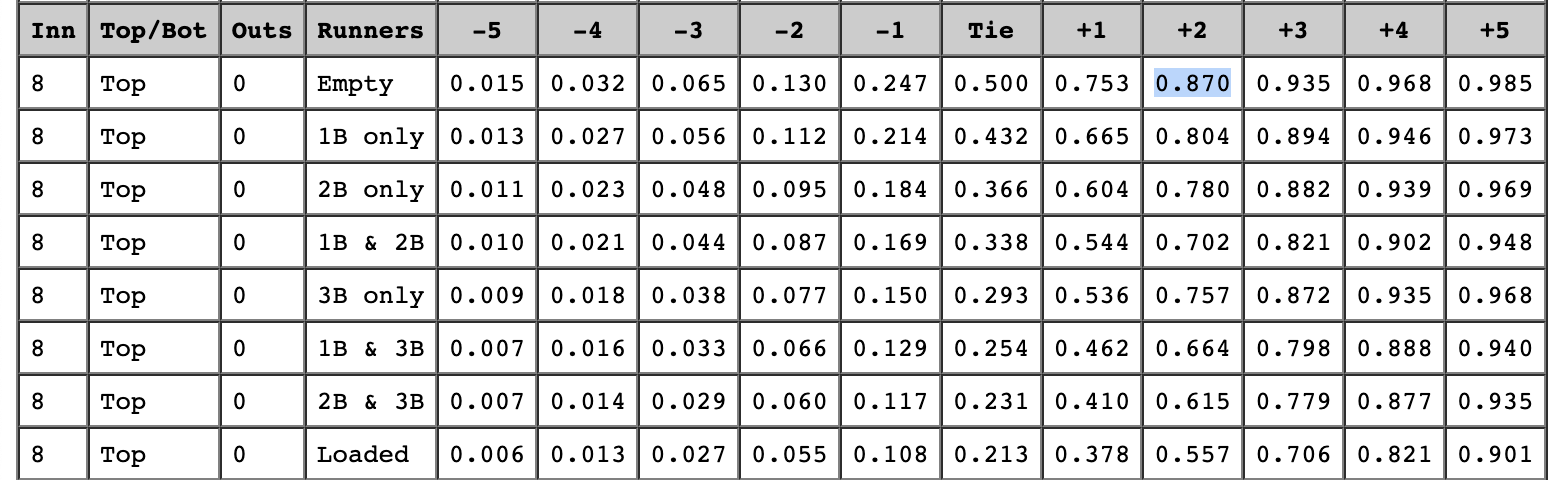
Figure 10. Top 8th Inning (representing between inning state)
The Guardians, with a +2 run differential, now have a WE of .870. What could go wrong?
8th Inning
Yankees score 3 runs and take the lead; Guardians down 3-4
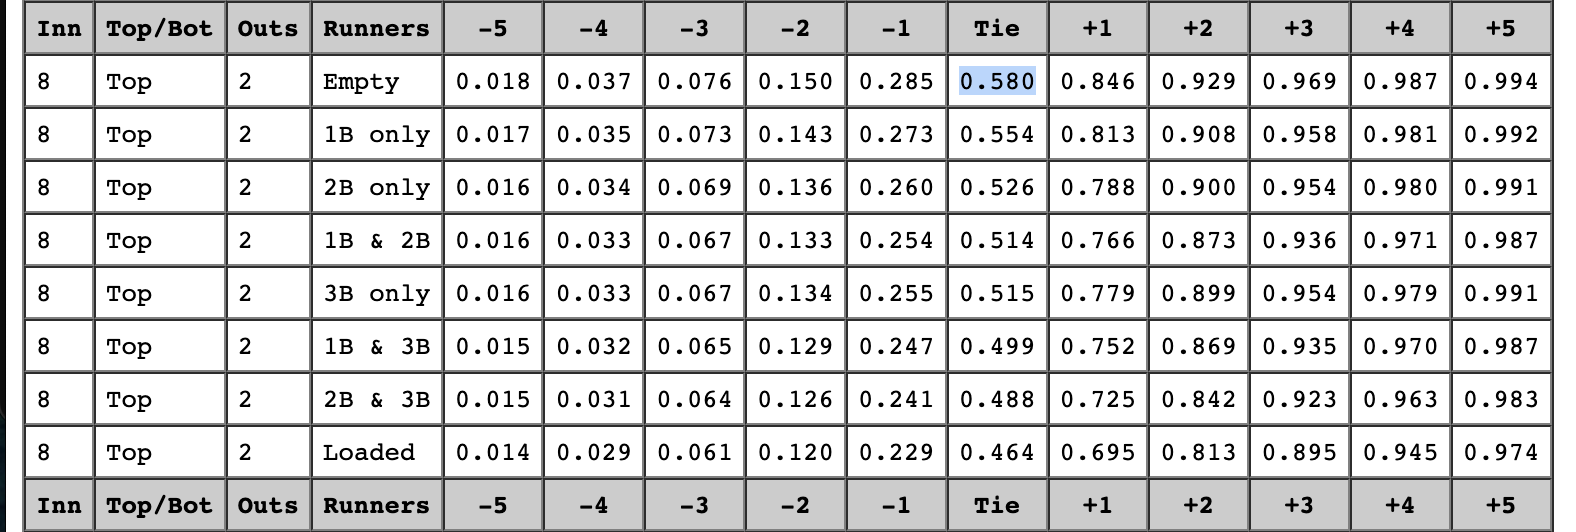
Figure 11. Top 8th Inning, score tied with 2 outs for Away
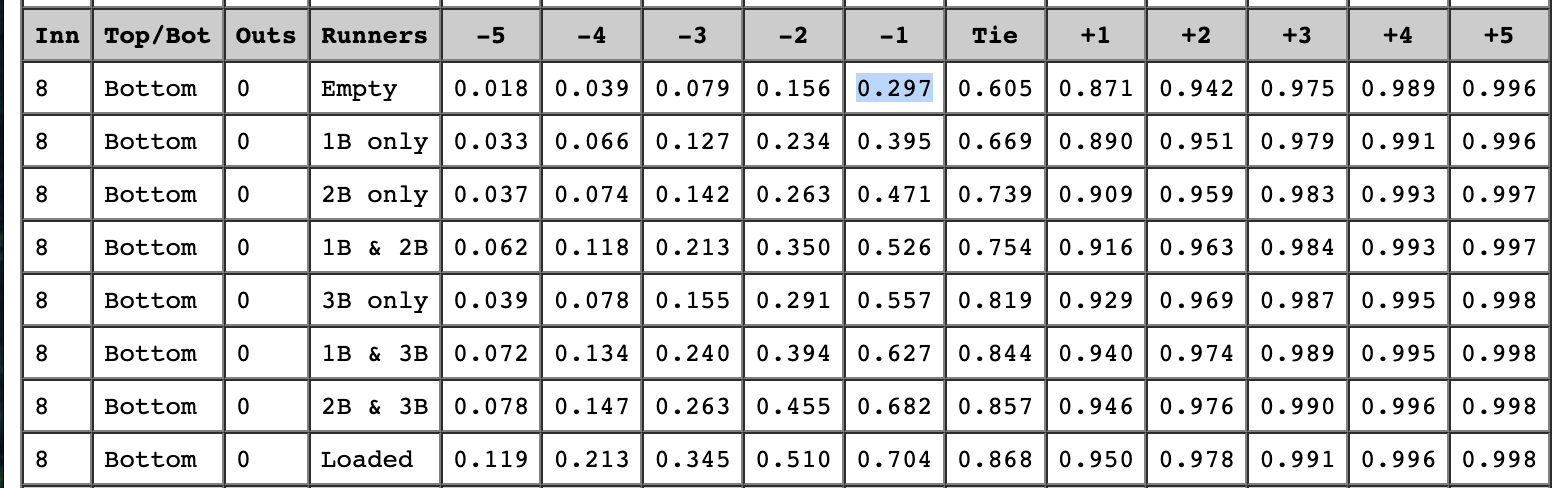
Figure 12. Bottom 8th Inning, representing when Home takes their first at-bat
The Yankees sneak up from behind and score 2 off a homer, tying the game, changing the WE for the Guardians to .580 (figure 10). And then change it again by scoring another run, meaning the Guardians are now down to a -1 run differential and a WE of .297 (figure 11). But wait, how could such an upset in score occur! How could this drastic shift have taken place, from a .870 WE for the Guardians dropping to .297? Time is running out!
9th Inning
Game tied 5 all; Going to extra innings
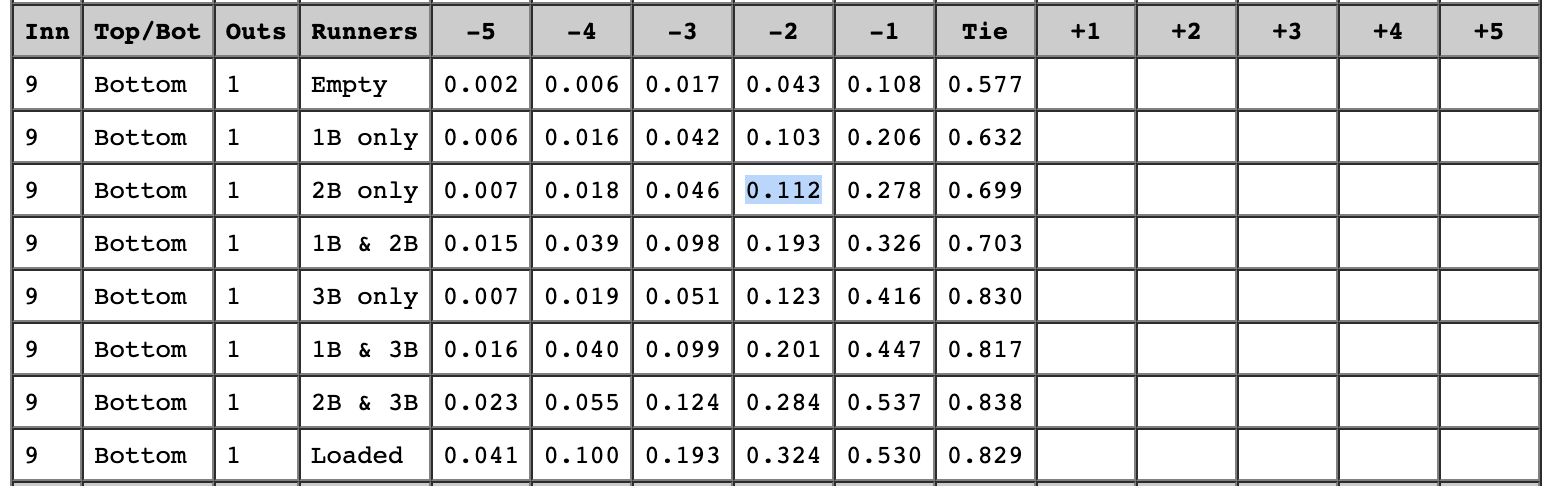
Figure 13. Bottom 9th Inning, representing runner on 2nd, 1 out, and a -2 run differential for the Guardians
Yankees score 1 run, turning the game into a -2 run differential for the Guardians. So when the Guardians are batting in the Bottom, right before a homerun occurs, there’s a player on 2nd, and the WE falls to it’s lowest at .112 (figure 12).
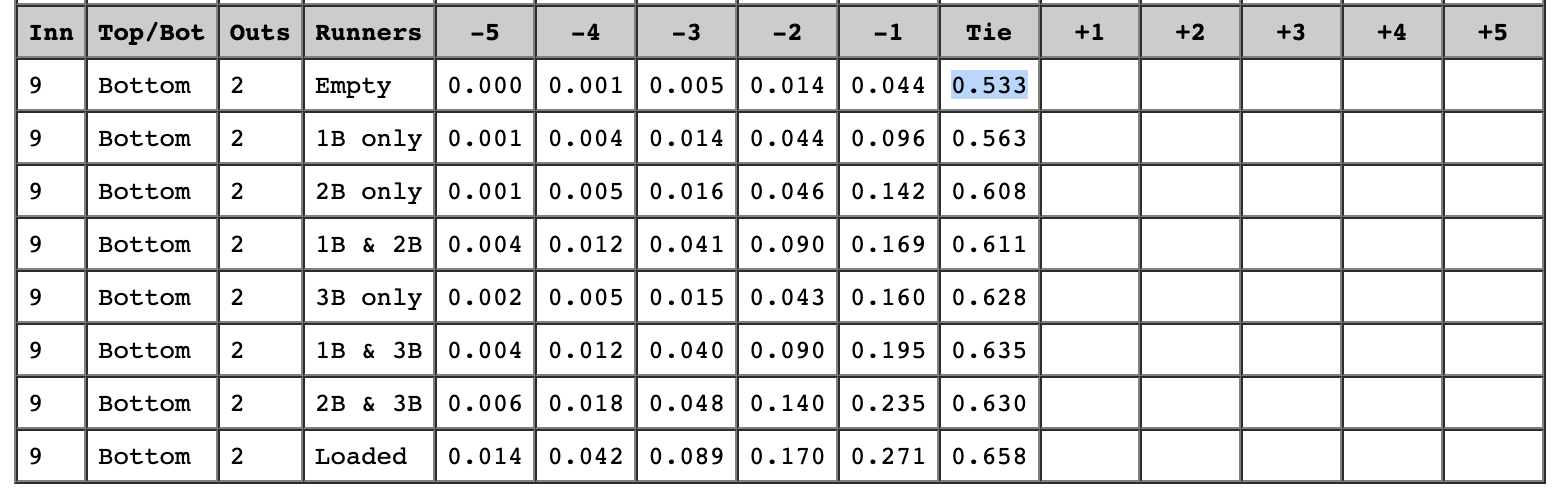
Figure 14. Bottom 9th Inning (representing between inning state, going into the 10th)
But! By the end of the Bottom 9th, the Guardians score 2 runs, and see a WE of .533 (figure 13). We’re basically back to the very beginning, with a tied state, but the Guardians have a slight advantage being the Home team (the last to bat in an inning) at roughly a 53% WE chance.
10th Inning
Yankees fail to score; Guardians have walk-off, 2-run homer & win game. This is the point where the Win Expectancy Matrix fails to load, so to speak. It simply isn’t charted this far since there’s not enough data to rely on (10th inning+ games do occur, but statistically not anywhere close to regular 9 inning games). Extra innings is also played like sudden-death, so whichever team is up in runs, at the end of both top and bottom innings, takes the win. Sorry to be anticlimactic; I know you were probably looking forward to another matrix table.
Welcome To The Real World (Series)
So why is a Win Expectancy Matrix so cool? Because it allows us to predict, in real time -based on current game state conditions - the likelihood of a team to win, calculated from previously collected data given similar conditions. It’s not a perfect science, and it shouldn’t have to be. In the case above, we were able to articulate that the Guardians win expectancy fluctuation range fell between .112 to .870, all within a given game. What’s extra cool is that this was not a linear fluctuation range, incrementally growing or decreasing in only a single direction (ie: increasing upwards or downwards only). During the actual live game, we had no idea who might win, and in fact, they kept trading places. The calculations allow us to have a better probable statistical sense for two things: 1) what each move is worth (gains): getting to third base when the game is tied with no outs statistically means a lot more than a single homer when your team is already up three-nothing; and 2) what each move might cost us (losses): two-outs when your team is down three runs significantly decreases your chances of coming back, or where the opposing team scores an additional run on top of their already two-run lead in the 9th creates a statistical probability of winning.
Even though the Yankees ultimately won the ALCS, the Guardians literally went down swinging, but not during this game. This was Game 3 of the series, where the Yankees had won the previous two games, and the Guardians masterfully battled it out through the 10th inning (which is one inning into extra innings, beyond the standard nine innings, for the two people reading this far who may not know this). This game meant a lot for the Guardians, as it offered the chance to beat the Yankees not just this one game, but perhaps more, and to take the whole series (spoiler: they didn’t, but it would have been cool if they had).
Check out the Win Expectancy Matrix I used here!